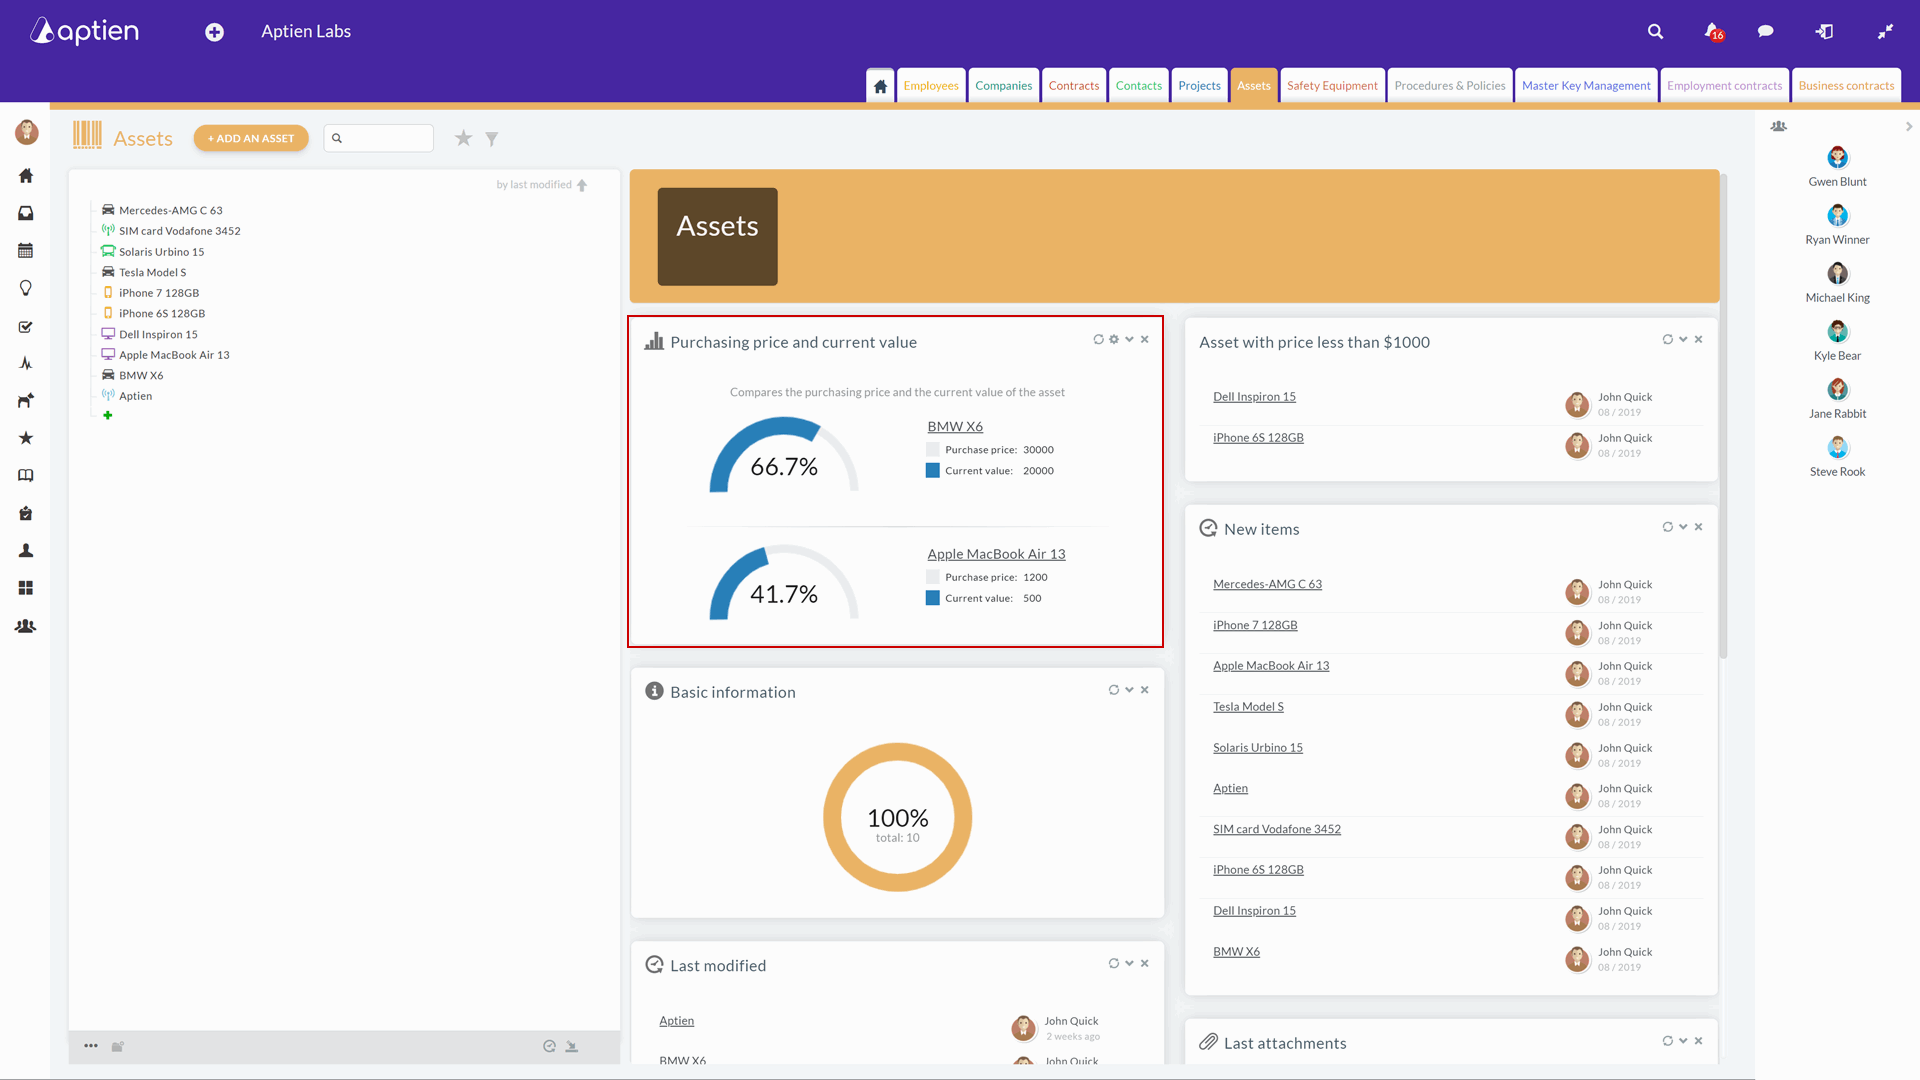
The chart is displayed on the dashboard
The chart for two numbers displays on the dashboard Organizer to compare two numbers using a semicircle chart. Typically, this is a comparison of some target value and its achievement. The graph will show the value as a percentage.
Examples might be actual mileage of total miles allowed, budget usage, or hours worked out of total.
Charts on the Organizer dashboard are most commonly used over the Projects Organizer, but it is possible to activate this feature in any other Organizer.