How to display a chart on your Organizer's dashboard
To display a chart, your administrator needs to activate the relevant plugin first.
- Activate the relevant plugin in the Organizer's settings
- Scroll down and click on "Manage plugins". Here you can see all your installed extensions, including the "Graph comparing 2 values". If it is not installed, click on "Add" and select the extension
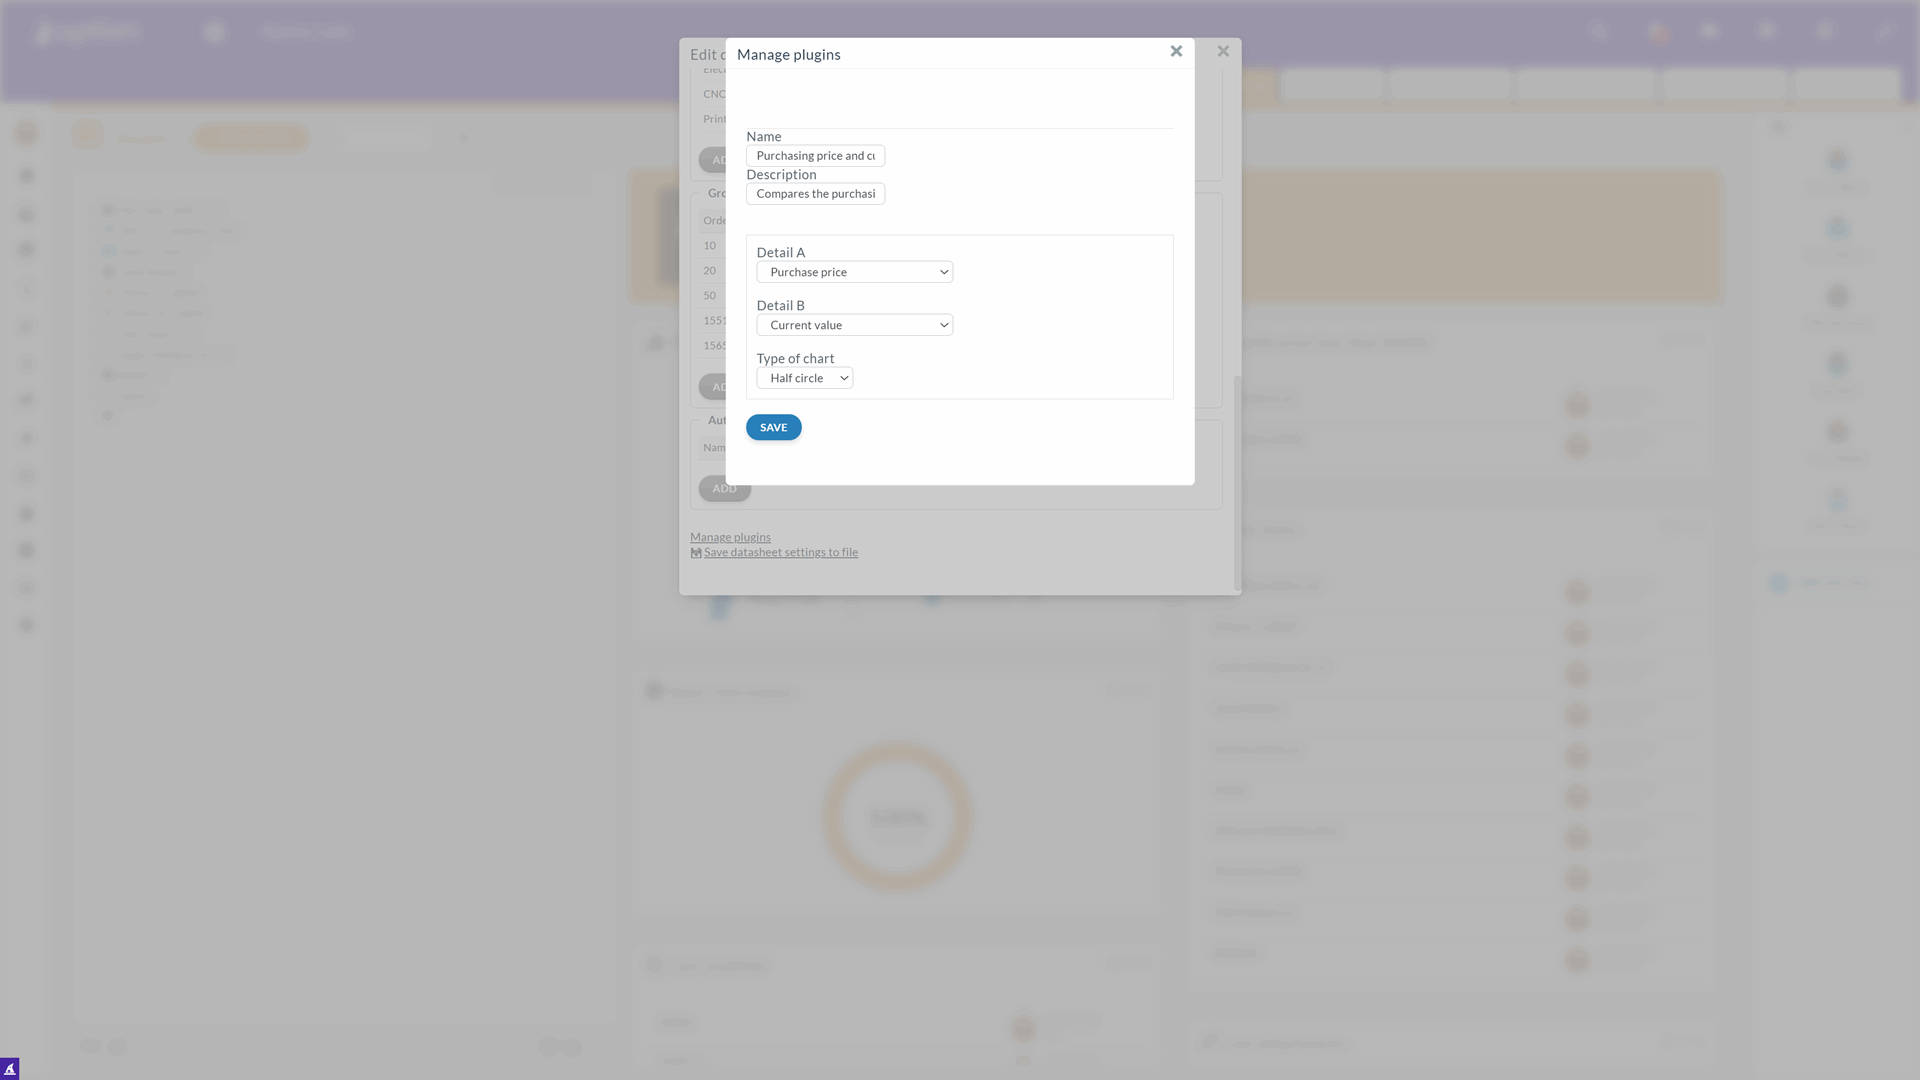
- Set the chart's name and its description. Select 2 values you want to compare. 2 values represent details from the Organizer, and their format has to be in number format. You can select from all the number format details that are in the Organizer (including table columns - the summarization of the columns)
- Select the chart type. Half circle displays percentages, and the bar chart displays number values. Save your settings
Each user can now display the chart on their dashboard, and each user needs to set up the items themselves.